ICSE Class 10 Histogram and Ogive — Mock Test (2027)
Free online mock test for Histogram and Ogive (ICSE Class 10 Mathematics) — 20 competency-based questions based on the latest CISCE 2027 syllabus, with instant marking. Try the samples below, then take the full test free.
What to expect: This mock test covers key concepts from the Histogram and Ogive chapter — including application-based and competency-focused questions aligned with how ICSE actually sets the paper.
Tip: Attempt without notes first to identify gaps, then review explanations for any wrong answers. Retake after a few days for best retention.
Sample questions
-
1.Using a graph paper, draw a histogram for the given distribution showing the number of runs scored by 50 batsmen and estimate the mode of the data.
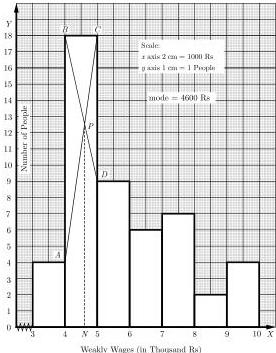
What is the mode of the given distribution?Runs Scored Number of batsman 3000-4000 4 4000-5000 18 5000-6000 9 6000-7000 6 7000-8000 7 8000-9000 2 9000-10000 4 - A.300 runs
- B.360 runs
- C.400 runs
- D.500 runs
-
2.Monthly daily wages of 110 workers, obtained in a survey, are tabulated below:
Use graph paper to draw a histogram and hence determine the mode of the given distribution.Wages (in ₹) Number of people 6000-7000 8 7000-8000 36 8000-9000 18 9000-10000 15 10000-11000 11 11000-12000 8 12000-13000 4 - A.₹7400
- B.₹7600
- C.₹7800
- D.₹8000
-
3.(i) Use graph paper for this question. (Take $2\mathrm{cm} = 10$ Marks along one axis and $2\mathrm{cm} = 10$ students along another axis). A histogram is drawn for the marks obtained by 164 students in a particular class. From the histogram, what is the mode of the distribution?
- A.58.25
- B.64.12
- C.70.50
- D.76.75
-
4.Following frequency distribution shows the expenditure on milk of 35 households in a locality. Draw a histogram for the data using graph paper and locate the mode.
Daily milk expenditure (Rs.) Number of households 0-20 5 20-40 6 40-60 9 60-80 6 80-100 4 100-120 5 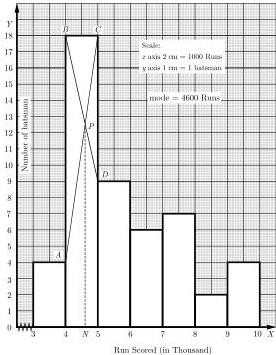
- A.₹40
- B.₹50
- C.₹60
- D.₹70
-
5.Marks obtained by 100 students in an examination are given below:
Draw a histogram for the given data using graph paper and determine the mode.Marks 0-20 20-40 40-60 60-80 80-100 100-120 Number of Students 10 15 20 28 20 7 - A.65 marks
- B.70 marks
- C.75 marks
- D.80 marks
Ready? Take the full 20-question test free — instant marking, no sign-up needed.
▶ Start free mock test